


With the election looming, the promises of the major parties can only be kept if enough tax is collected to pay for them, including from those big corporations that avoid paying. A new search tool will help to expose them, thanks to Mark Zimsak, Jason Ward, Roman Lanis and Mikhail Shashnov.
What do mega port operator DP World, coal mining giant Peabody, packaging behemoth Amcor, metals and mining wholesaler Citic Resources, and News Corp Australia have in common? For the last ten years, their Australian operations have paid no income tax. Zero, zilch, nada.
With a combined income (revenue) in FY 2023 of $8.997B, those five companies contributed no tax to Australia. The largest of them, Peabody, had $4.7B in revenue and reported $5.2m in taxable income, but still no tax to pay.
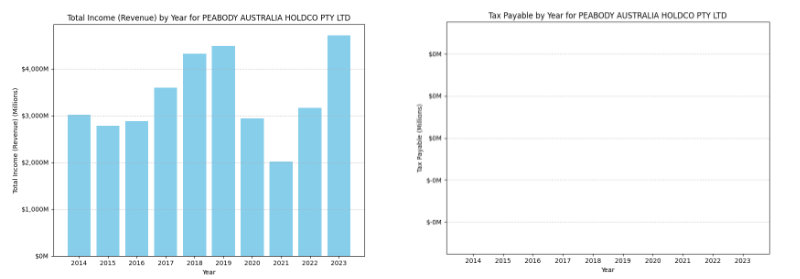
Data by infotax.media.
Over the past ten years, there have been a total of 98 corporations that have not paid any income tax.
Who pays the tax?
As Australia prepares for our upcoming federal election and its impact on future spending and revenue, it is time to put the question of corporate tax, who pays and who doesn’t, back on the kitchen table.
While some call for corporate tax cuts and slashing the public sector workforce – D.O.G.E. style – most Australians want more and better public services. One clear way to enhance our collective well-being is to ensure that corporations generating the highest returns in Australia, from Australians, are contributing fairly and appropriately and not scamming us all.
In order to help all Australians take a closer look at corporate tax payments, a coalition of researchers has developed a simple tool so anyone can look at who pays and who does not.
This tool, a collaboration by researchers from CICTAR (Centre for International Corporate Tax Accountability & Research), the UTS (University of Technology Sydney) Business School and the Tax Justice Network – Australia, has taken a full decade of Australian Taxation Office (ATO) corporate tax transparency data and combined it into one database with a drop-down menu for selecting a company name to pull up its tax history.
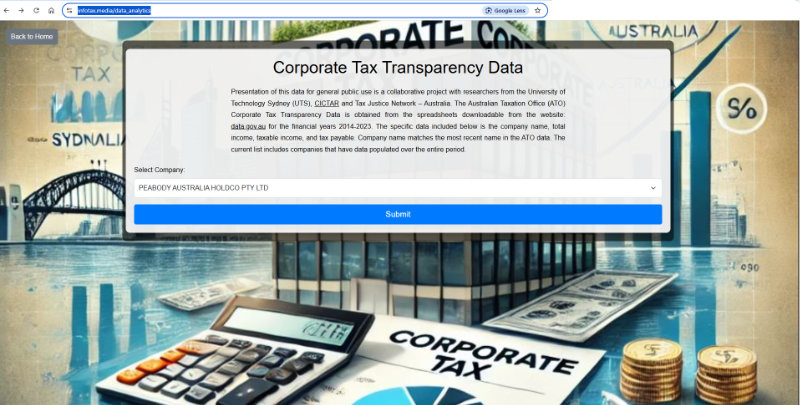
Click to access Infotax Media search page.
It is now possible for anyone to easily examine the history of revenues and tax payments over the last decade for over 1,000 of the largest corporations operating in Australia. If you need help analysing the data or want more information, reach out to the authors.
Australia collects a higher proportion of tax from corporate income tax than any other OECD country. However, there is plenty of multinational tax dodging that still needs to be tackled in Australia, not to mention globally. The less income tax paid by the largest multinationals, the more must be paid by the rest of us from personal income tax or through GST.
Additionally, if multinationals are not paying taxes on profits genuinely earned from our spending, then Australian companies, generally doing the right thing, are operating at a major competitive disadvantage. This also stifles genuine competition, exacerbates inequality, and increases monopoly power.
Foxtel: transactions you can’t trust, tax evasion you can’t ignore
Financing the lucky country
The majority of us want excellent public services where all people, businesses and communities can thrive. As highlighted by Ken Henry and others at Per Capita’s recent Community Tax Summit, many changes are long overdue to our overall tax and transfer system. However, a clear place to start is to check that the largest corporations pay tax like the rest of us. Transparency is the first step.
If the richest corporations get away with shirking obligations to society, it undermines the credibility of the overall tax system and broader faith in public institutions.
To maintain tax transparency by way of public scrutiny of corporate tax affairs the Infotax database contains data on 1028 companies. These are the companies that appear in all ten years of the ATO corporate tax transparency disclosures, from 2014 till the current release for 2023 (10,280 company/year observations). The following variables can be viewed using the Infotax tool:
- total income;
- taxable income; and
- tax payable.
This data is directly obtained from ATO disclosures. Additionally, the Infotax tool calculates and presents:
- taxable income margin (taxable income/total income);
- tax revenue rate (tax payable/total income); and
- tax rate (tax payable/taxable income).
For each of the six variables, an average is calculated for each company over the 10 years, and bar graphs are provided for extra visual effect. While the tax rate typically and expectedly comes close to the 30% tax rate, most tax avoidance occurs to reduce the level of taxable income. The taxable income margin represents an estimated profit margin and a consistently low rate can be an indicator of tax avoidance (or a genuinely low margin business).
Of the 1028 companies in the Infotax database, all report total income in each of the ten years (2014-2023), Not all of them report taxable income; resulting in 7,983 taxable income observations out of the possible 10,280. Thus over 20% of taxable income observations over the ten years are likely to be losses. While most of these are likely legitimate losses, some may be artificially created for tax purposes and may be worthy of further investigation.
With respect to tax payable between 713 and 750 companies paid tax over the ten years and in total that comes to 7,303 tax payable observations out of a possible 10,280 for the same period.
Almost 30% of tax payable observations over the ten years represent zero tax paid.
Total income (revenue declared) collected from the 1028 companies increased from $1.342 trillion in 2014 to $1.947 trillion, or 45%.
Taxable income increased from $135.387 billion in 2014 to $295.732 billion in 2023, or 118%.
Finally, tax payable increased from $34.111 billion in 2014 to $75.422 billion in 2023 (121%). Tax collected from the 1028 companies currently included in the Infotax database has more than doubled in 2023 in comparison to 2014. That’s great news for the funding of our public services!
Stay tuned as we expand the list of corporations included in this database and add more data and analyses to inform broader debates related to corporate tax. Specific case studies of companies will be the subject of future articles as an example of how to apply the Infotax tool to study corporate tax behaviour using the ATO’s tax transparency data.

Mark Zirnsak acts as secretariat for the Tax Justice Network in Australia and is a senior social justice advocate for the Uniting Church.

Jason Ward is Principal Analyst at the Centre for International Corporate Tax Accountability & Research (CICTAR). Ward has been a frequent commentator on corporate tax issues as an analyst and spokesperson for the Tax Justice Network – Australia (TJN-Aus). He is currently a Visiting Fellow at the Business School at the University of Greenwich and a PhD student in accounting at the University of Technology Sydney.

Mikhail Shashnov is a data wizard currently completing a PhD in Accounting and Taxation at the University of Technology Sydney (UTS), building on a background in Economics and Statistics. His research interests lie in data science and analytics to solve complex business problems.

Roman Lanis joined the School of Accounting in 2004. He has undertaken research into tax avoidance in Australia and globally, with numerous top-rated publications. Roman also appeared before the Senate enquiry into tax avoidance in 2015-2016 and has authored many industry reports.