


The pressure is on the Government to address a near $1 trillion debt and spiralling cost of living when it presents the Budget on May 9. How different things would be if we had the sense to make multinationals pay properly for the billions they make mining and drilling Australia’s natural resources. Daniel Bleakley reports.
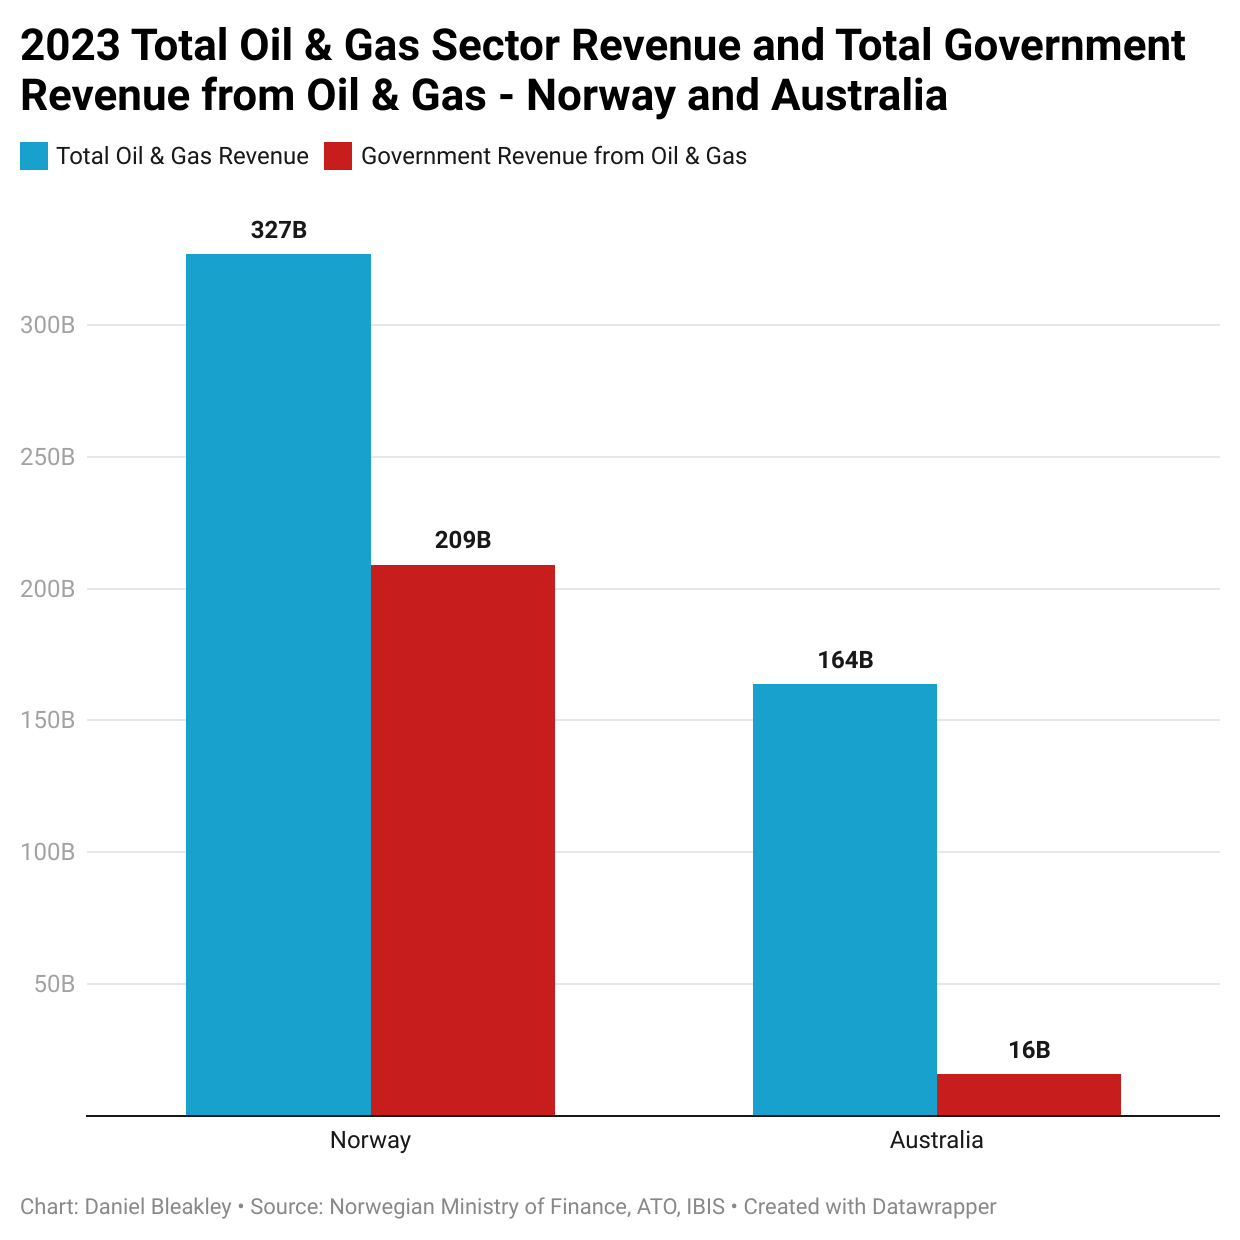
This year, the Norwegian Ministry of Finance estimates that the Norwegian public’s share of Norway’s oil and gas export profits will be around NOK 1,384 billion ($A209 billion). That’s about $A150,000 for every Norwegian family of four in 2023 alone.
In a statement last week, APPEA’s chief Samantha McCulloch said payments from Australia’s oil and gas industry to state and federal governments would be around $16 billion this year.
The $16 billion is made up of $9 billion of corporate tax, $5 billion of royalties and excise, and just $2 billion in Petroleum Resource Rent Tax (PRRT). Note that APPEA’s figure of $16 billion comes from the industry and is ‘best case’. The industry has a track record of talking big on future tax payments but delivering little of what they promised.
The 2023 industry forecast of $16 billion in taxes and royalties equates to around 7.7% of the amount that the Norwegian public will receive from their oil and gas exports this year.
The Norwegian government estimates that total revenue from their oil and gas sector in 2023 will be around $A327 billion with the public receiving 64% of that in the form of Norway’s 78% tax on oil and gas export profits as well as dividends from state owned operators.
The Australian oil and gas industry is estimated to generate $A164 billion in total oil and gas exports in 2023 with the public’s $A16 billion in corporate tax, royalties and PRRT representing just 9.8% share of total oil and gas revenue.
To really hammer this home the graph below compares the estimates of total oil and gas revenue and government revenue for both Norway and Australia in 2023.
How did this happen? Why is the Australian public getting so utterly fleeced on the sale of natural resources that belong to us all? And how did this industrial scale wealth extraction come to be? To answer these questions we need to look back over the past 30 years to see how it has played out.
Three decades of giving away Australia’s natural resources
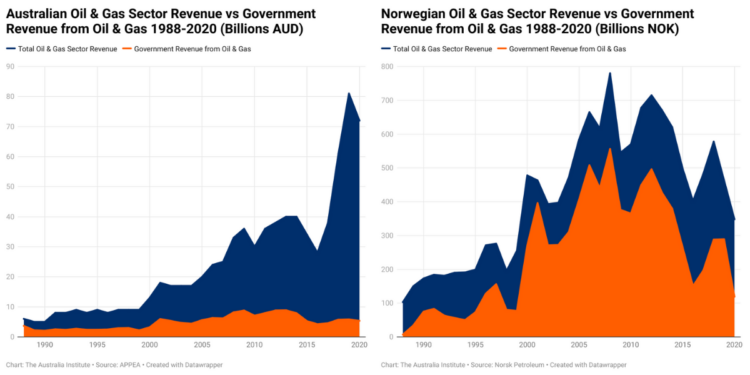
Some readers may be familiar with the graphs below. They were part of my research with The Australia Institute last year and were shared widely on social media. They were also featured by Alan Kohler on his finance report during ABC’s 7pm news in October last year.
In the 1990s the Norwegian government started taxing the export profits of Norway’s oil and gas sector at 78%. The tax consisted of a 55% resource tax on top of Norway’s 22% corporate tax.
The graphs below show total oil and gas revenue (blue) and total government revenue from oil and gas (orange) for both Australia and Norway over three decades.
During the 1990s Norway also set up the Norwegian Sovereign Wealth Fund and enacted a law that every krone (NOK) that the government received from the oil and gas industry in the form of resource taxes, corporate taxes and dividends from state owned operators would be invested directly into the fund.
Another law was enacted that stipulated that only the returns of the fund, not the capital, could be spent by the government in any given year. This meant that the government’s revenue from the oil and gas sector would continue to build the fund year after year. As of April 2023 the fund is worth NOK14.5 trillion or $A2.1 trillion in Australian dollars.
To put that into perspective, that’s the equivalent of $A389,000 for each of Norway’s 5.4 million citizens or around $A1.6 million for every Norwegian family of four.
While Norway was saving, the Australian public was being fleeced
As Norway was building its massive fund to benefit all Norwegians, Australians were having their fair share of resources slowly whittled away through multiple amendments to the PRRT allowing for exemptions as well as oil and gas giants shifting their profits offshore to tax havens. More about that later.
The graph below uses data from Australia’s petroleum industry lobby group APPEA (Australian Petroleum Production and Exploration Association) however the data is represented as government revenue (taxes etc) as a percentage of total oil and gas sector revenue.
APPEA generally represents its members’ tax contributions in absolute figures so that taxes paid appear to grow incrementally over the years. Graphing the data as a percentage of total revenue gives the picture of what’s really happened as Australia’s gas exports boomed.
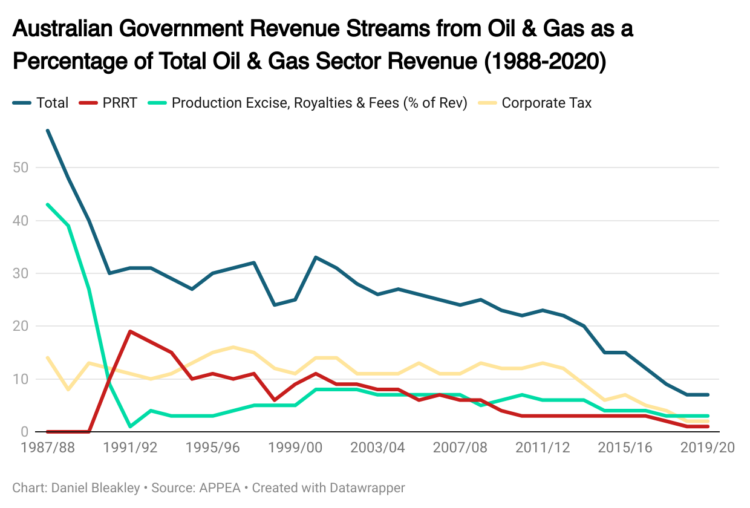
In the late 1980s the tax take from Australian oil and gas revenues was over 50%.
In the early 1990s PRRT (shown above in red) was 19% of total oil and gas revenue but by 2020 it had dropped to just 1%.
We see a similar drop in corporate tax paid by the sector. In 1997 corporate tax paid on oil and gas export profits was 16% of total revenue. By 2020 it had dropped to just 2%.
Foreign fossil fuel juggernauts dominate the annual MWM Top 40 Tax Dodgers chart
And while the Norwegian public has been raking in the lion’s share of the sale of its natural resources, Australian taxpayers have actually been subsidising the fossil fuel industry to the tune of over $A10 billion per year.
Research by The Australia Institute shows that in 2021-22, Australian federal and state governments provided a total of $11.6 billion worth of spending and tax breaks to assist fossil fuel industries.
Where are all those billions going?
So how are oil and gas companies operating in Australia able to get away with paying such a pittance in taxes?
To gain an idea of what the Norwegian and Australian oil and gas sectors look like from a macro perspective we need to zoom out and look at the breakdown of where revenues are flowing.
At a macro level, all oil and gas revenue can only really go to one of three different places.
- Private Sector Share of Revenue (After Tax Profits)
- Government Share of Revenue (Taxes and Royalties etc)
- Reported Expenses
To determine the total amount of taxation (government revenue), a company reports its total sales revenue and its total expenses. Taxation is on profit so the higher the reported expenses the lower the gross profit and therefore the lower the taxation.
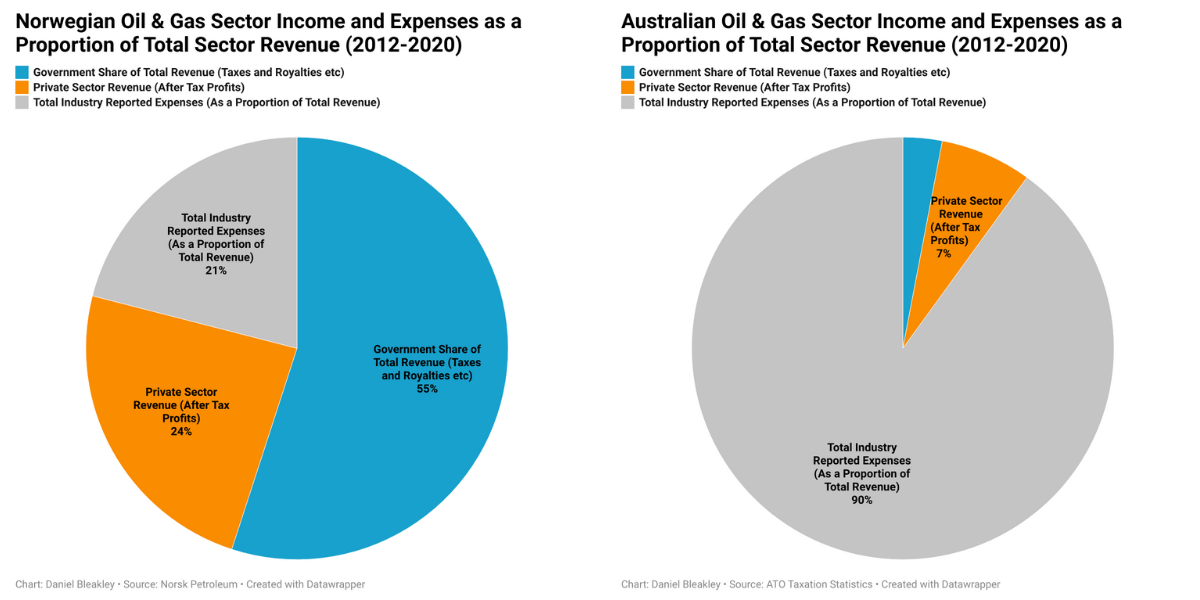
The pie charts below compare the total revenue breakdown for the Norwegian and Australian oil and gas sectors over a nine year period between 2012 and 2020. The entire pie in each case represents the total sector revenue for that country.
Immediately we can see the stark difference in the two nations oil and gas sectors. The big exporters are gaming Australia’s tax system by inflating their expenses.
Over the nine year period we can see that the Norwegian oil and gas sector reported 21% of its total revenue as expenses while the Australian sector reported a staggering 90% expense to revenue rate.
How can this be? Although there are differences with the Australian sector being LNG dominant while the Norwegian sector is majority oil, the additional costs associated with LNG liquefaction and shipping are trivial compared to the 90% expense rate reported by the Australian sector.
If the reported expenses in the Australian sector are legitimate it would represent a woeful return on capital.
If the additional costs associated with LNG resulted in a gross profit margin of just ten percent, then the industry is extremely inefficient and should be shut down immediately. Such small returns represent a very small return on capital.
Why are expenses so high in the Australian oil and gas industry?
Using ATO taxation statistics we can drill down deeper into the breakdown of oil and gas sector expenses by ATO category. As per the pie chart above in the graph below we can see that the total sector reported expenses have hovered around 90% of total sector revenue over the nine year period.
Between FY2015 and FY2018 the sector’s reported expenses were actually higher than the industry’s total revenue.
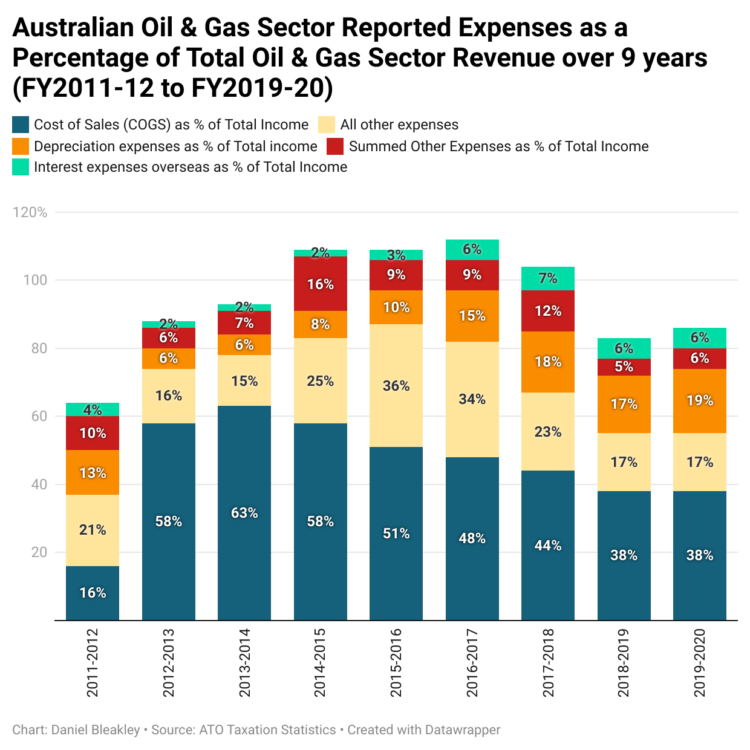
The high expense categories in the sector are dominated by “Cost of Sales”, “Depreciation” and “All Other Expenses” (a specific ATO category).
The total income reported to the ATO by the Australian oil and gas sector between 2011 and 2020 was $750 billion.
The table below shows the Australian oil and gas sector’s top six expense categories over the nine year period in gross numbers and as a percentage of total income. Again the data is from ATO taxation statistics.

Top 6 Australian Oil and Gas ATO Reported Expense Categories FY2011-12 to FY2019-20. Source: ATO Taxation Statistics.
The ATO defines “Cost of Sales” as:
“The cost of anything produced, manufactured, acquired, or purchased for manufacture, sale or exchange in deriving the gross proceeds or earnings of the business”
“Cost of Sales” is the expenses directly related to the production of the LNG. It does not include capital costs which are accounted for in the “depreciation” category.
So the Australian oil and gas sector is reporting to the ATO that the costs of extracting, liquifying and shipping LNG are almost 50% of its total sales revenue. The additional expenses take the total expenses to 90% of revenue.
The ATO reported industry wide expenses are also in stark contrast with companies’ own investor reports which show a much lower production cost and higher gross profit margins.
For example Woodside’s 2021 Full-Year Results Briefing shows a gross margin of 45% of total revenue and that “production and other costs” (33%) and “depreciation and amortisation” (22%) combined add up to total expenses of just 55%. Significantly lower than the industry-wide long term reported total expense ratio of 90%. Woodside’s investor report also show’s gross margins of around 50% over the past five years.

Woodside’s 2021 Full-Year Results Briefing (P19)
Looking at Woodside’s per unit cost of production also raises questions. Woodside’s 2021 investor report shows that their unit production cost was just $5.30 per BOE (barrel of oil equivalent) with a realised sales price of $60.3 per BOE giving a unit production cost of just 8.8%.

Woodside’s 2021 Full-Year Results Briefing (P14)
Shifting profits offshore by increasing locally reported expenses
Part of the huge difference between Norwegian and Australian oil and gas industry expenses could be due to financial engineering to reduce locally reported profits and therefore locally paid taxes.
There have been numerous examples of this financial engineering to reduce taxable income reported in Australia by multinational resource companies in recent years. In July last year Rio Tinto settled a dispute with the ATO for $991 million for its use of “offshore marketing hubs” and overstated borrowing costs to transfer profits offshore to avoid paying taxes in Australia.
Another way oil and gas companies have been shifting profits offshore is through borrowing from offshore shells or parent companies at artifically high interest rates.
“Interest Expenses Overseas” totalled to $A30.7 billion from FY2011-12 to FY2019-20. As shown in the graph below the sector’s offshore borrowing costs are almost five times higher than its onshore borrowing costs.
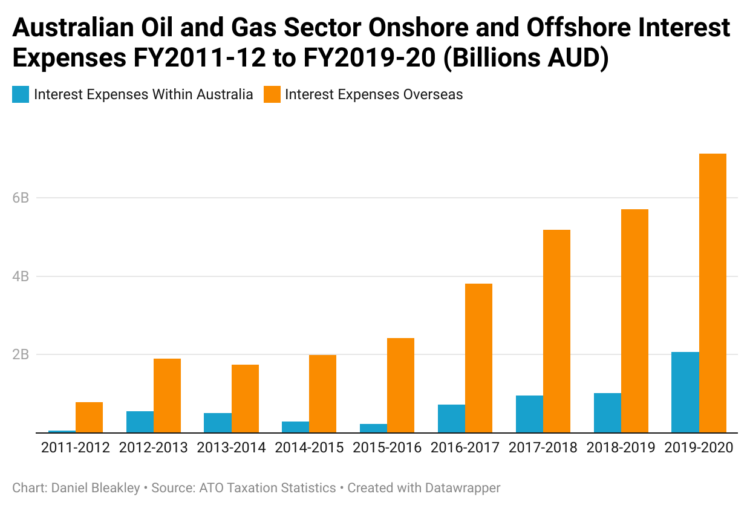
The Australian entity of foreign owned oil and gas giant Chevron was caught engaging in a transfer pricing scheme whereby Chevron’s Australian entity borrowed at an interest rate of 9% from an entity it created in the US state of Delaware called Chevron Funding Corporation (CFC).
CFC was borrowing at just 1.2% while lending at 9% to the Australian entity. Delaware is a known tax haven so this artificially inflated Chevron’s expenses in Australia and transferred profits to the low taxing state of Delaware. As the graph above shows this practice could be widespread costing the Australian government tens of billions.
The “Interest Expenses Overseas” category is just 4% of the reported 90% expense to income ratio being reported by the oil and gas sector in Australia. If tens of billions of dollars is flowing out of tax revenue though just this small category, imagine how much could be being lost through financial engineering in the other categories.
The true cost of production for the Australian LNG sector needs to be investigated thoroughly. The use of transfer pricing in the conversion of fossil gas to LNG that artificially inflates production costs as well as the practice of offshore borrowing from known tax havens with low interest rates is potentially costing Australia hundreds of billions in tax revenue.
Australia’s PRRT is not fit for purpose
In a speech he made at the Kennedy Business School at Harvard University in 2014, then Prime Minister of Norway, Jens Stoltenberg, laid out in detail how Norway took control of its oil and gas sector and built the world’s largest sovereign wealth fund.
“We tax them quite heavily, it’s a 78% tax rate” said Stoltenberg,
And they told us that was impossible, but they come and invest, and we tax them and they stay.
Australia’s Petroleum Resource Rent Tax is extremely complicated and is riddled with exemptions and loopholes. Only a handful of people in the country actually understand this complexity which allows the industry to use highly paid experts to exploit these loopholes and exemptions. Not to mention the lobbyists they pay to put this complexity in to the system in the first place.
In contrast Norway’s petroleum export tax system is simple. Stitch up all the expense loopholes and tax the industry at 78% on its export profits.
The PRRT is not fit for purpose. It should be completely scrapped and replaced with a Norwegian style resource taxation system.
The Australian public deserves the lion’s share of the sale of resources that belong to us all.
Norway v Australia: crisis makes the case for a sovereign wealth fund incontestable

Daniel is a qualified mechanical engineer, climate activist and former Anne Kantor Research Fellow at The Australia Institute working in the Climate and Energy program. His areas of interest include climate policy, electrification, renewable energy and fossil fuel taxation.