


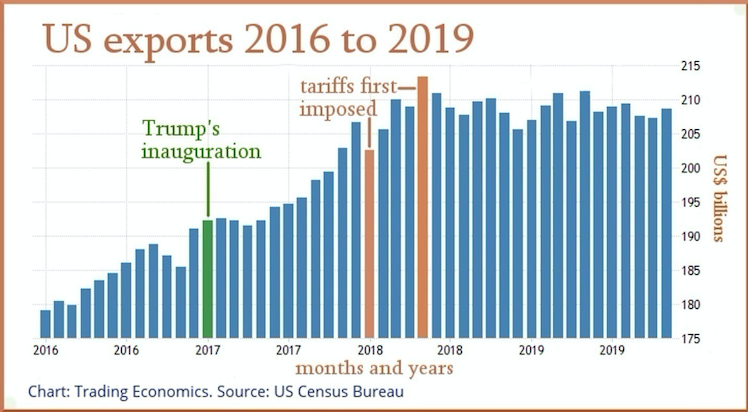
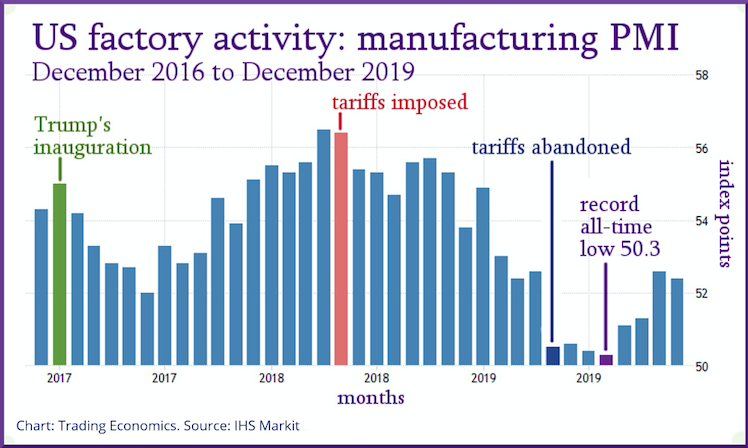
This is revealed starkly by the trajectory of US exports over the last four years. Exports increased steadily throughout 2016 and 2017. Then, in early 2018, President Trump opened hostilities via belligerent tweets, claiming “trade wars are good, and easy to win”. He imposed tariffs first in January 2018, then more in May. From that point onwards, exports have declined.
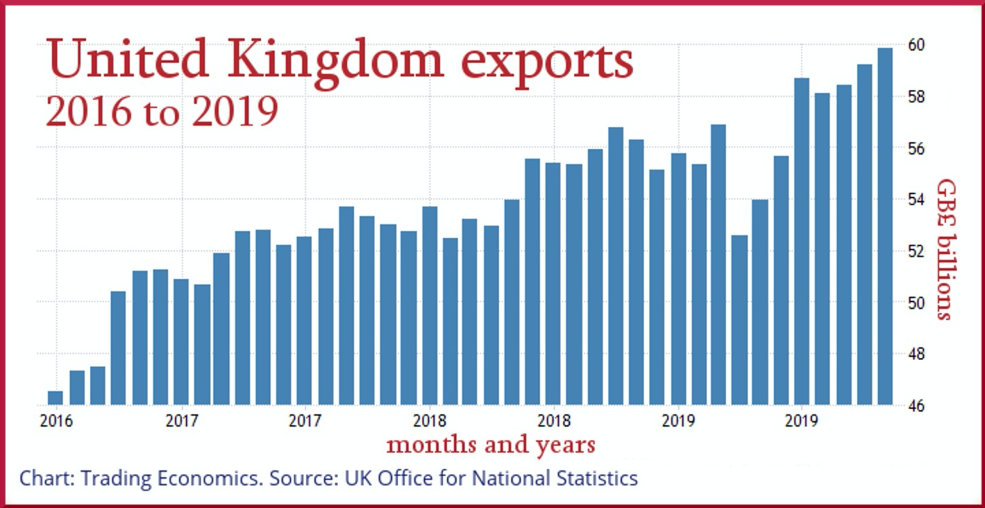
This is not normal. This is not good. Since the end of the global financial crisis (GFC) all well-managed economies have enjoyed the strong global boom in investment, trade and jobs. Most US trading partners have increased their total exports every year. The United Kingdom is typical:
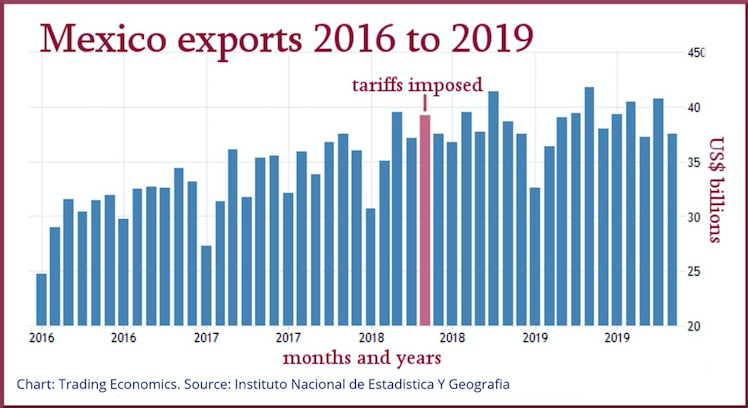
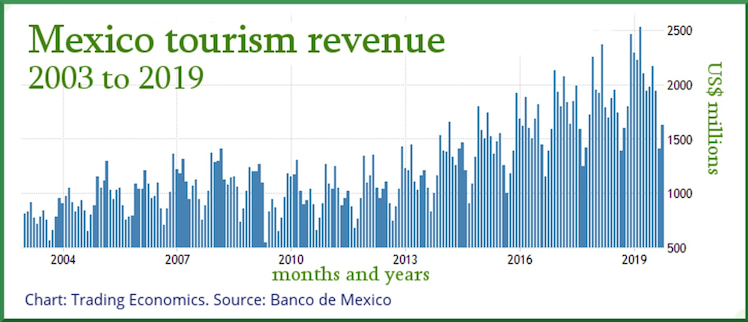
A more pertinent comparison is neighbour Mexico, specifically targeted by Trump’s tweets and tariffs. In fact, its export growth continued steadily upwards, despite the tariffs.
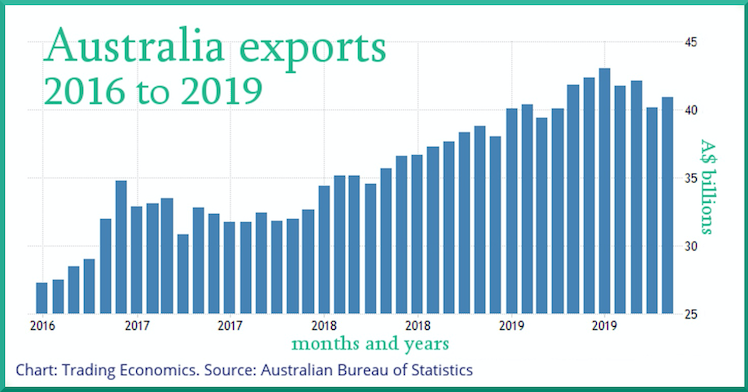
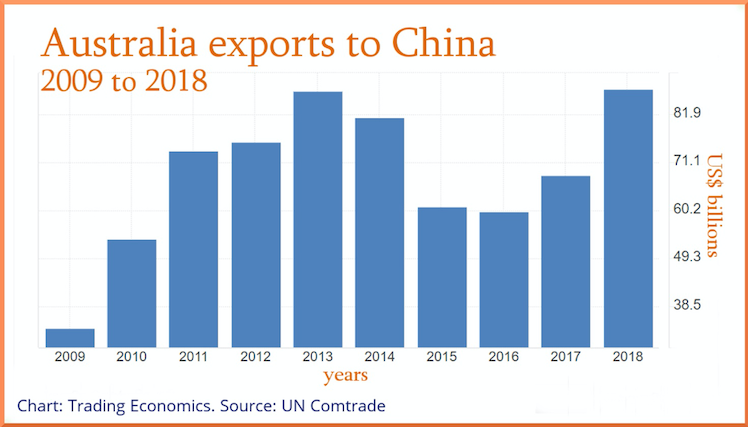
Australia also benefitted from America’s export woes with all-time record high exports in 2019.
The bottom line in trade outcomes is the trade balance — exports minus imports. This quantifies Trump’s trade wars losses. Over the last 26 months, the US trade deficit has been deeper than $45 billion 24 times and below $52 billion 18 times. It got as low as $60.8 billion in December 2018.
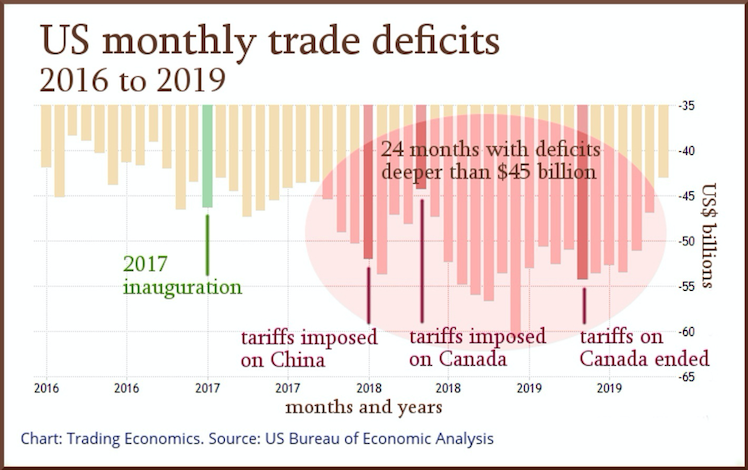
This is not what Trump expected. He believed the trade deficits under President Obama – which averaged $40.7 billion over the eight months before the election – were “massive” and that his trade war would soon fix this. The worst monthly trade deficits in many years followed straight after. Eventually, in May 2019, Trump abandoned the metals tariffs targeting Canada and Mexico. He has since backed off threats of further action against China and retreated on existing tariffs. It was a complete surrender although, of course, Trump will not admit that. The trade deficit has contracted slightly in the months since but is still above Obama era levels.
What went badly wrong?
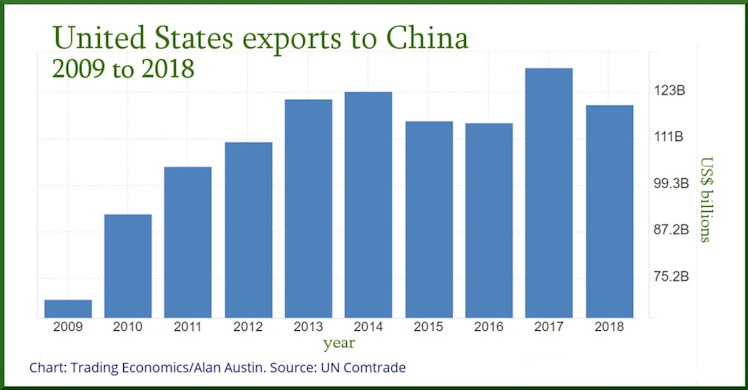
The theory was that China and other trading partners would suffer when imports to the US became more expensive and they would be forced to accede to US demands. This did not happen. The decline in sales by China to the US was matched, or exceeded, by increased sales to other countries. China then retaliated, and US exports to China fell dramatically in 2018 — to levels below 2013, 2014 and 2017.
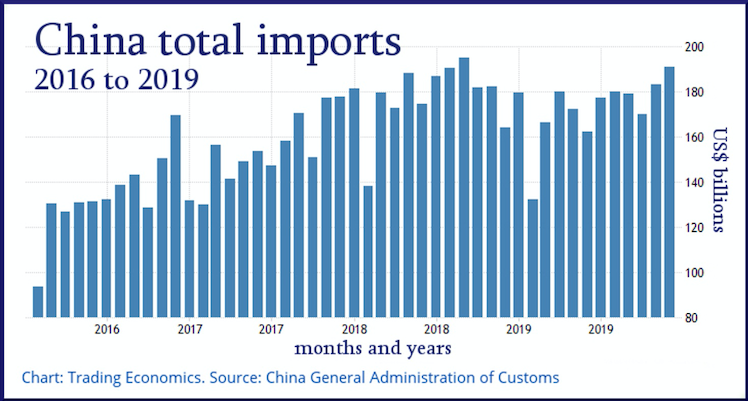
But this did not hurt China. Their total export volumes continued to increase. And their total import volumes continued as normal, reaching all-time records in 2018 and staying high through 2019. [Editor’s Note: the last two paragraphs have been edited from an earlier version.]
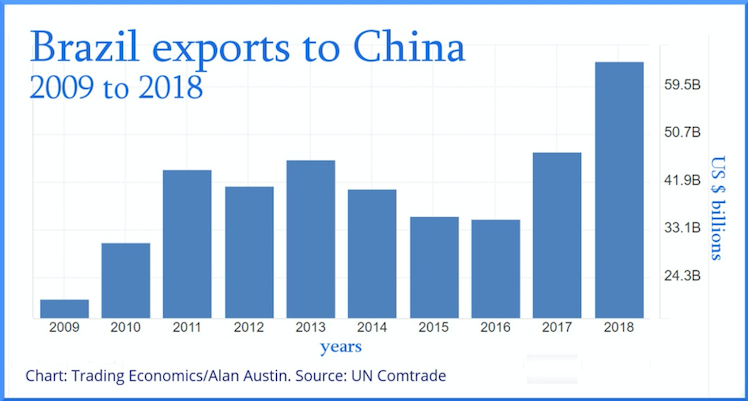
This is because China and other countries simply swapped suppliers, and increased trade with America’s competitors, including Australia, Argentina and Brazil. While Americans went bankrupt by the thousands, Brazilians enjoyed a bonanza.
Australia’s similar gain from America’s misfortune is seen in exports up 29% from $US68.0 billion in 2017 to $87.7 billion in 2018. Data for 2019, when available, will probably be higher still.
Long term damage
Many sectors of the US economy have suffered badly. Manufacturing declined immediately the steel tariffs were imposed in May 2018. The recovery has begun now Trump has caved, but painfully slowly, and not before hitting an all-time low in August.
Tourism is an intriguing sector, as this downturn appears to be by virtue of the US losing its favoured destination appeal rather than any direct economic barrier.
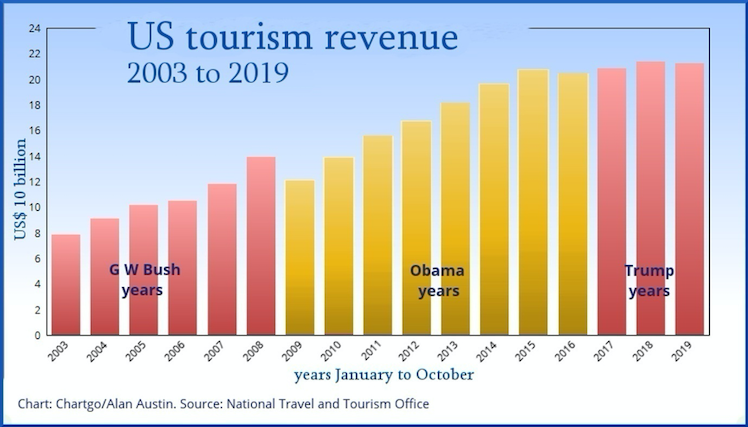
Many popular tourist destination countries experienced a dip during the GFC in 2009 and 2010 but few, if any, have flattened from 2016 onwards as in the US.
Taking Mexico again, fewer tourists arrived in 2009 and following, but numbers have grown strongly since then, accelerating in the last three years.
Americans who have suffered most are on the farms, where collapsing incomes have led to tens of thousands of foreclosures and bankruptcies and many thousand suicides. We do not yet have the full data on these tragic outcomes. They will make grim graphics in due course.
Comparisons with other economies
A compelling illustration of how poorly the US is now faring relative to the rest of the world can be derived from the exports data at tradingeconomics.com for all members of the Organisation of Economic Cooperation and Development (OECD). This is the club of 36 wealthy free enterprise economies between which comparisons are routinely made.
Exports have boomed in most developed countries with 29 of the 36 enjoying exports growth above 12% over the last three years. Nine have seen their exports surge by more than 35% over that period. The average growth is a healthy 22.9%. The US, in contrast, achieved just 9.18% over that period, ranking a lowly seventh from the bottom.
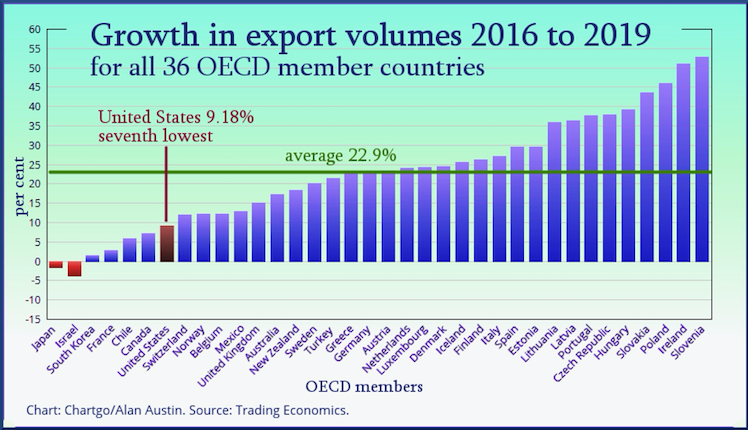
Of those 36 economies, 13 recorded their highest export level last October, while another 12 set records in the preceding seven months. The US is one of a small minority not participating in the current trade boom. Its peak was twenty months ago.
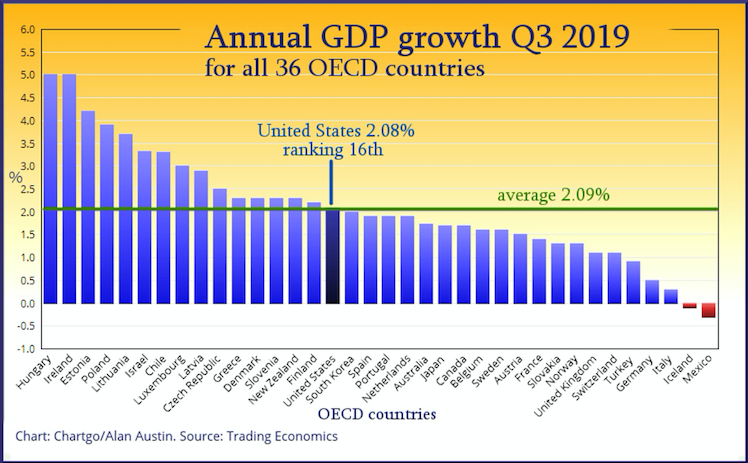
The flow-on effect of losing the trade wars can be seen in several unfortunate outcomes. Annual growth in gross domestic product (GDP), for example, in the US is now just 2.08%. This ranks a dismal 16th in the OECD. The US ranked seventh in 2014 and sixth in 2015.
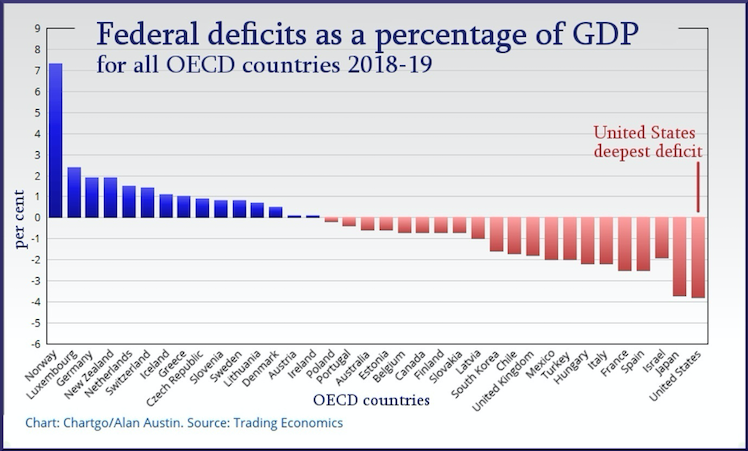
The US economy is still doing well on total jobs. But that is the only satisfactory area. On wages growth the US now ranks 14th out of 36, down from second in 2014 and fifth in 2016. On median wealth per person the US now ranks down at 17th, on personal savings 24th, on home ownership 25th, and on federal debt to GDP 32nd. On budget deficits at a percentage of GDP, however, the US now ranks dead last.
Repairing the damage
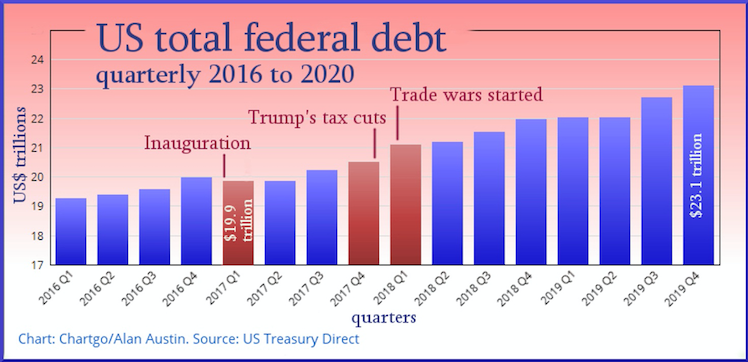
With federal debt having blown out by more than three trillion dollars as a result of the tax cuts and trade wars, it will take some time to repair the damage. We can track this by following the deficit and debt trajectories. So far, there is no sign of recovery.
We will see the beginning of an upturn as soon as the red bar at far right in the silver graph, above, becomes blue and the US joins the economies in budget surplus. The blue bars in the pink graph, below, will contract when federal debt reduces rather than increases. This may take decades.
Trump continually boasts that his economy is “the best in US history”. It isn’t. The hard data shows it is further down the ranking of well-managed economies than it has ever been.
Trade wars are easy to start. Not so easy to win.
———————–
Destruction and climate denial — Australia’s bushfires seen from abroad

Alan Austin is a freelance journalist with interests in news media, religious affairs and economic and social issues.