

”Only when the tide goes out do you discover who’s been swimming naked.” So said Warren Buffett. And the tide has ebbed on the Coalition’s claim to be superior economic managers. Exposed by its bungled response to the pandemic, both in the provision of health protections and economic safety nets, the government has proved Buffett’s aphorism. Alan Austin crunches the numbers.
The Coalition has added $600 billion to the national debt with barely a whisper from the corporate media. Even today, at the release of the 2021 Mid-Year Economic and Fiscal Outlook (MYEFO), the response to a seemingly endless horizon of record deficits was muted in the pro-government The Australian and Australian Financial Review.
Both had been vociferous critics of Labor debt, yet now they are meekly accepting Coalition vows of tax cuts at a time when the nation can ill afford them. The double standard rings loudly.
Treasury’s Office of Financial Management has announced that Australia’s gross debt has reached $871.4 billion. That is a significant number if we recall that gross debt was $271.2 billion when the Labor government lost the September 2013 election.
The Coalition – which was elected primarily on commitments to reduce drastically “Gillard’s debt disaster” – has now added $600 billion to the modest debt Labor left.
The differences between Labor and Coalition debt are more than just quantity.
The quantum
Labor borrowed $213.2 billion in five years and nine months. That averages $37.1 billion per year. The Coalition borrowed $600.2 billion in eight years and two months. That’s $73.5 billion a year, near enough to double the rate.
Borrowings to build infrastructure
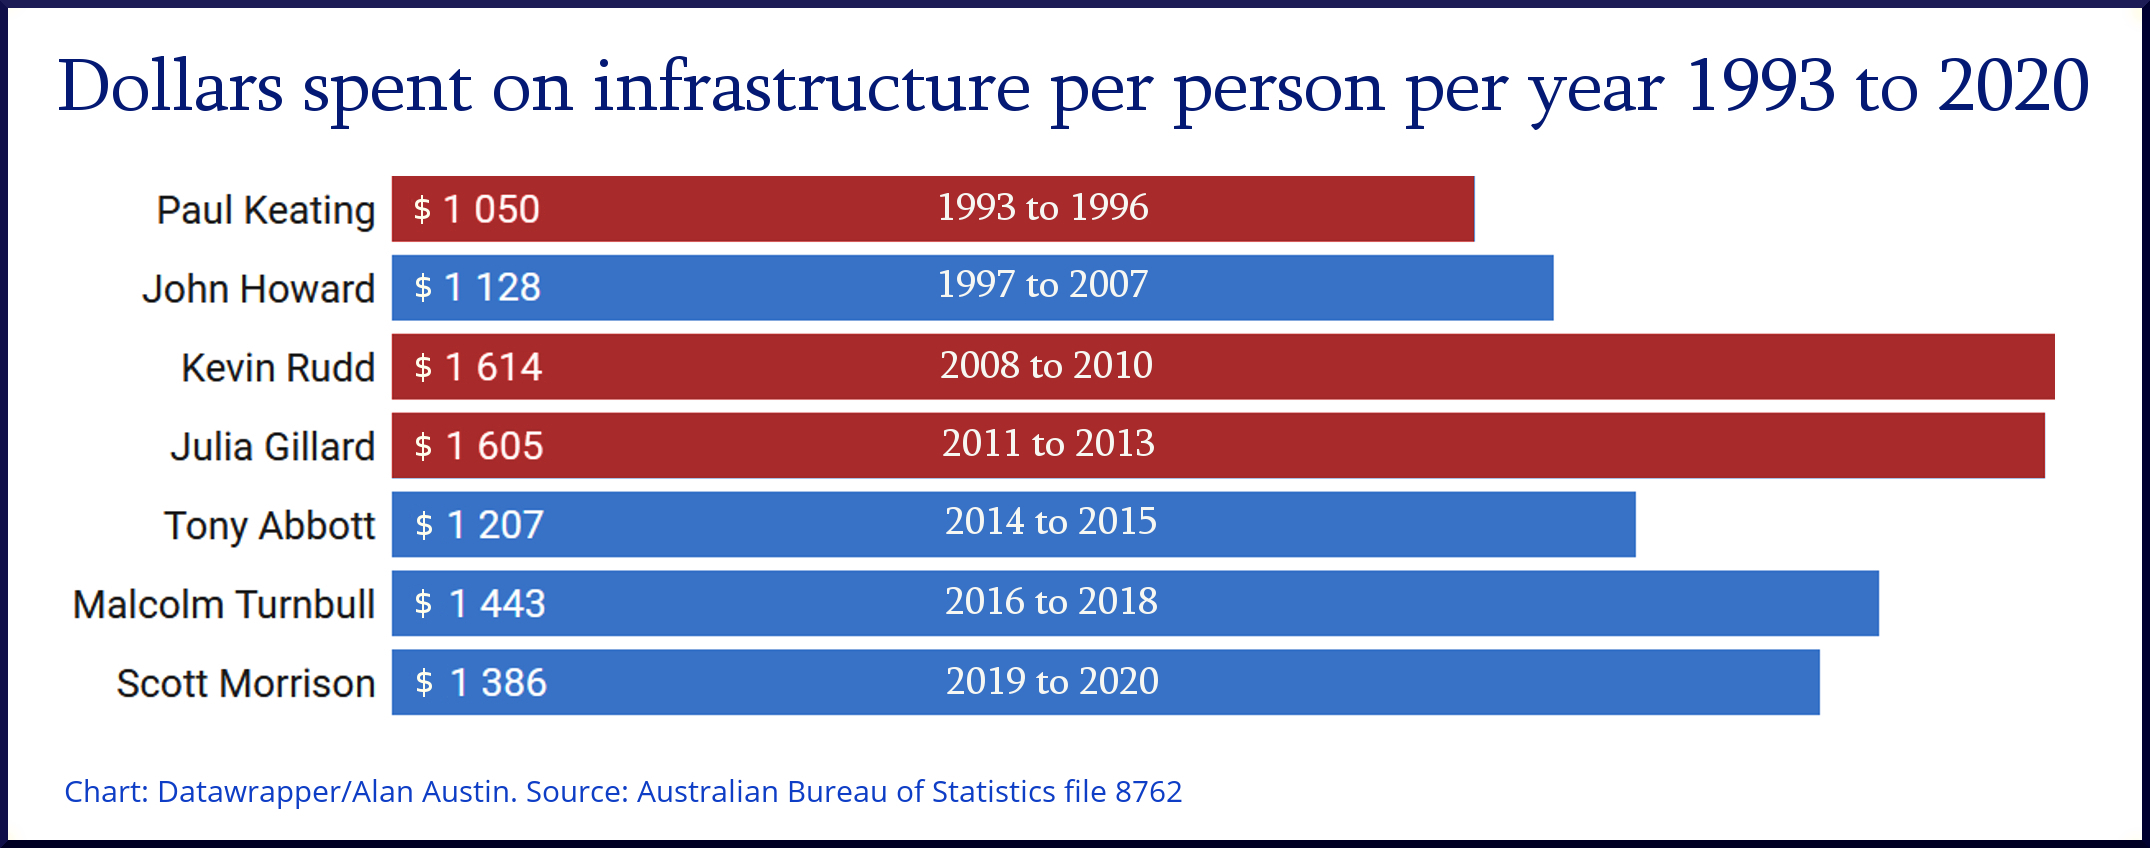
Most of the $213.2 billion Labor borrowed was applied directly to hard assets. These included roads, railway lines, port facilities, energy and water infrastructure, insulation, upgrading sports facilities, school and community buildings, defence housing, national parks and other national assets.
In calendar 2011, for example, Labor borrowed $48.6 billion and spent $37.2 billion on infrastructure. That was 77%.
In contrast, far less of Coalition borrowings went into bricks and mortar. In 2017, the Coalition borrowed $80.6 billion and spent $36.5 billion on infrastructure. That was 45%.
Staving off recession
The money Labor borrowed and invested prevented Australia from going into recession during the global financial crisis (GFC) by targeting households, building productive assets and maintaining tax revenue. Australia was one of only three OECD members to avoid a disastrous recession through the GFC and the only one to avert widespread job losses. In 2009 Australia had the OECD’s highest annual GDP growth rate.
In contrast, when the Covid-induced global downturn hit last year, the Coalition handed money to corporations, reduced infrastructure outlays, cut the tax rate and allowed widespread company tax evasion. Australia then copped one of the worst recessions of all OECD countries and saw “employees” working zero hours soar to 8.5% of the workforce. Australia currently ranks 31st on annual GDP growth among the 38 OECD members and is near the tail on unemployment also.
Debt repaid during the boom times
Gross debt was $58.7 billion when Labor won the 2007 election. During the few months until the Global Financial Crisis whacked the developed world, Labor steadily reduced that, getting it down to $52.4 billion by August 2008. Labor also reduced the quantum by $5.7 billion in the first five months of 2013, as the GFC tapered off.
In contrast, the Coalition continued to stack on debt every year through the post-GFC boom.
To take 2017 as an example again, New Zealand reduced its debt from 24.0% of GDP to 21.6% that year. Iceland effected a reduction from 79.9% to 69.3%, and Ireland from 74.1% to 67%. Another 25 OECD members reduced their debt substantially that year while five saw little change. Only Chile, Luxembourg and Australia increased debt to GDP significantly in 2017. Australia’s borrowings went up from 25.3% to 28.4% of GDP, despite the buoyant global economy and booming exports.

Greatest decline in global ranking
When Labor left office, Australia’s gross debt was 16.8% of GDP. This was the third lowest in the OECD. Only Chile and Estonia were lower. Today, Australia’s gross debt is 39.5% of GDP. That blowout – of 22.7% of GDP – is close to the worst of all OECD members.
Media treatment
Federal debt was the critical issue the media used to destroy the last Labor government. Headlines appeared day after day, week in week out shrieking about “debt spiralling out of control”, “Labor’s debt timebomb”, “skyrocketing debt”, “a debt spiral, deeper and deeper” and “the budget in freefall”.
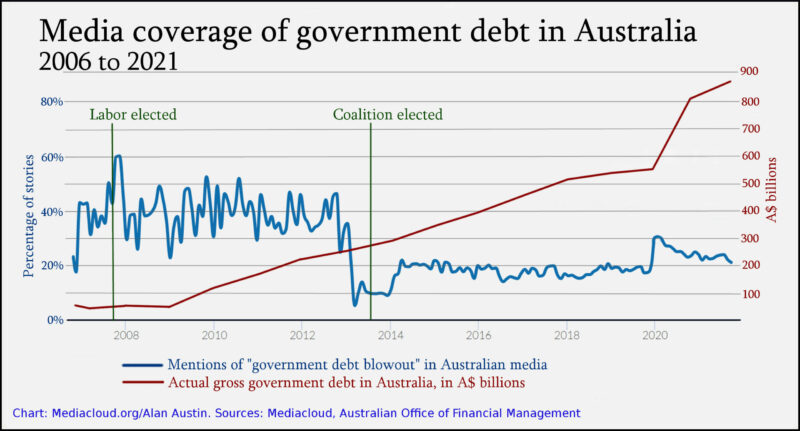
The mediacloud.org databases show us the frequency with which the term “government debt blowout” has appeared in the national media over the years.
The red line shows actual gross debt, using the scale at right. The blue lines indicate how often “government debt blowout” was published, using the scale at left. As the chart reveals, there is no relationship.
Interest on the debt
Treasurer Joe Hockey was horrified before the 2013 election that Australians were paying “$35 million a day in interest. That’s $13 billion a year.” He and his successors have not fixed this.
Interest paid in October (latest figures) was $1522 million, or $49.1 million per day. With interest rates now at all-time lows and set to rise, this may rise rapidly.
The Finance Department’s monthly report for October shows the Coalition has spent more on debt interest so far this financial year than on housing and community amenities, recreation and culture, natural disaster relief and public order and safety combined.
Net debt also ballooning
When the Coalition took office, Australia’s net debt – gross borrowings minus interest-bearing loans – was a modest $161.3 billion. That was matched, however, by the strong increase over the preceding five years in national assets, as listed above.
Net debt was recorded in October at $597.5 billion – nearly four times higher. But with no significant infrastructure or other benefit to show for it.
Such is Australia’s doom.

Alan Austin is a freelance journalist with interests in news media, religious affairs and economic and social issues.