


What would Menzies say? Treasurer Josh Frydenberg would have us believe Australia’s economy is back to leading its rivals after two years of pandemic. The latest economic update shows instead that we are not only lagging the field, we have had one of the poorest outcomes in the developed world, writes Alan Austin.
The quarterly national accounts provide invaluable data on the state of Australia’s economy. Yesterday’s are the worst set of outcomes since the Australian Bureau of Statistics (ABS) began tabulating this series in 1959, when the prime minister was Robert Menzies. That’s based on Australia’s historic data, or comparison with other developed countries, or both.
Clearly, the Covid pandemic has affected many industries and affected several data sets. But it does not explain Australia plummeting down virtually all global tables. Given Australia’s low rates of infections and deaths, we would expect Australia to have risen in the rankings rather than tumbled.
In fact, most of the declines have been evident well before Covid, including Australia entering a per capita recession in early 2019.
Treasurer Josh Frydenberg said yesterday that “the Australian economy is recovering strongly”. The data does not support this.
Worst economic growth on record relative to global conditions
The quarterly growth in gross domestic product (GDP) was negative 1.92%, the third worst on record. The worst was in the second quarter last year. This is one of the poorest outcomes in the developed world.
Most OECD member countries recorded positive quarterly growth in September, with the US, Germany, Switzerland, the Netherlands, Italy, Belgium, Portugal, Poland, Turkey and Spain all above 1.5%. France, Norway, Austria and Chile were all above 3%.
Lowest global ranking on annual GDP growth
The annual GDP growth figure came in at 3.85%. Although this does not look too bad historically, it ranks close to the bottom in the developed world. The United Kingdom, Iceland, Turkey and Hungary all recorded September annual growth above 6%. Estonia, Chile and Columbia were all above 8%.
Of the 38 OECD member countries, Australia’s annual GDP growth now ranks 31st, by far the lowest since records have been kept. Australia has nearly always been in the top 20. During the global financial crisis, Australia was number one.
Wages as a percentage of GDP lowest ever
For the second consecutive quarter, total compensation to workers was below 47% of GDP. A level that low has appeared only rarely since 1959.
For most of the period before 1972, the workers’ share of GDP increased steadily to 52.4% when Gough Whitlam won office. It increased further through his turbulent tenure to end up at 57%. It stayed above half until the wages and prices accord in the Hawke years allowed it to slip lower in trade-offs for other worker benefits. But it stayed above 47% for almost the entire period until 2016. It has been below that four times since Scott Morrison became treasurer, including the last two quarters.
The level for the June quarter this year, revised in yesterday’s data to 46.14%, is the lowest on record.
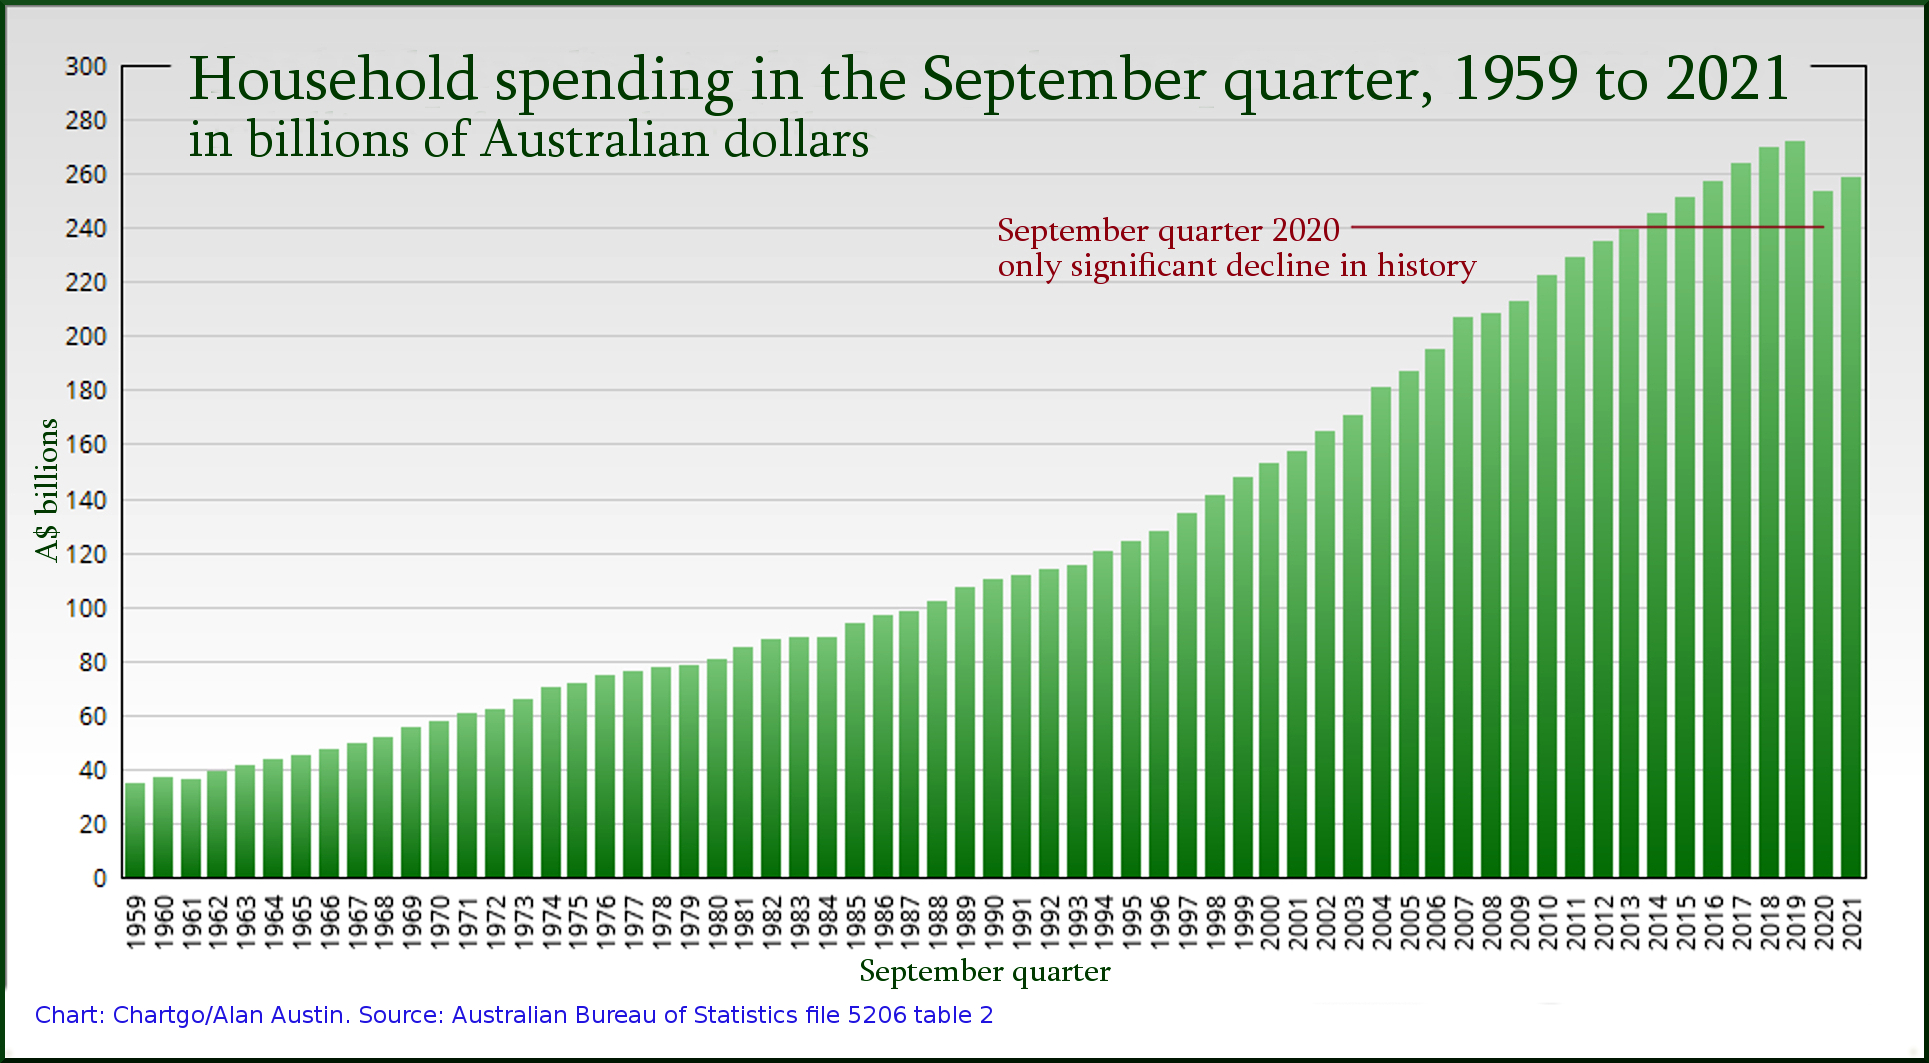
Household consumption down
Household spending has reflected the extraordinary capacity of Australia’s economy to ensure families enjoy increasing living standards, despite global and local turmoil. Until now.
Between 1959 and 2020, the money Australian households have spent has increased annually, even through the severe global recessions of the early nineties and the early 2000s and the global financial crisis of 2008.
The first setback ever was in 2020 when the September quarter spending declined from the previous September by a thumping 18.1%.
Yesterday’s figures show spending – and hence quality of life – has barely recovered. It remains 5% below 2019 spending, and still below spending in 2017 and 18.
Productivity stalled
The critical measure of production achieved for hours worked remains stagnant. After increasing from 86 index points to 96 in the seven years from 2007 to 2014, this has struggled to improve in the seven years since. By the end of 2019, productivity was still only 98.8 points.
There was a welcome increase in the September quarter over recent levels to 102.6 index points, but that remains below the modest peak of 103.0 in June 2020.
Manufacturing still in decline
The manufacturing index increased slightly from 100.0 points to 101.5 in June. This is still well below the 105.4 when the Coalition took office, and below the 102.3 points when Morrison took the top job.
$224 billion in superannuation reserves lost
Faced with the devastating GFC, the Rudd government made direct payments to taxpayers to stimulate the economy, maintain demand for goods and services and thereby save jobs and avert recession.
In contrast, faced with the Covid-induced global recession, the Morrison government gave handouts to corporations and obliged many taxpayers to withdraw their superannuation.
Since the ABS began recording Australia’s superannuation reserves in 1988, the quantum has increased by an average of 2.54% quarter on quarter. If this rate of growth had continued through 2020 and 2021, reserves at the end of June this year would have been $3,783.2 billion.
The actual level of reserves for June was $3558.9 billion, a difference of $224.3 billion. That is a fair estimation of the superannuation losses.
As mentioned, the data does not support Frydenberg’s rosy assessment of the Australian economy.

Alan Austin is a freelance journalist with interests in news media, religious affairs and economic and social issues.